12. Canny to Detect Lane Lines
text
Canny Edge Detection in Action
Now that you have a conceptual grasp on how the Canny algorithm works, it's time to use it to find the edges of the lane lines in an image of the road. So let's give that a try.
First, we need to read in an image:
import matplotlib.pyplot as plt
import matplotlib.image as mpimg
image = mpimg.imread('exit-ramp.jpg')
plt.imshow(image)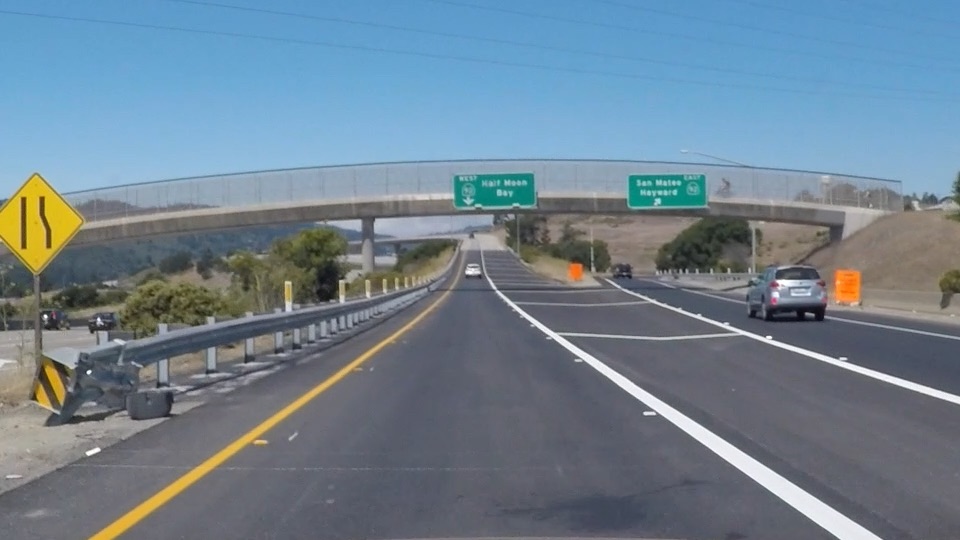
title
Here we have an image of the road, and it's fairly obvious by eye where the lane lines are, but what about using computer vision?
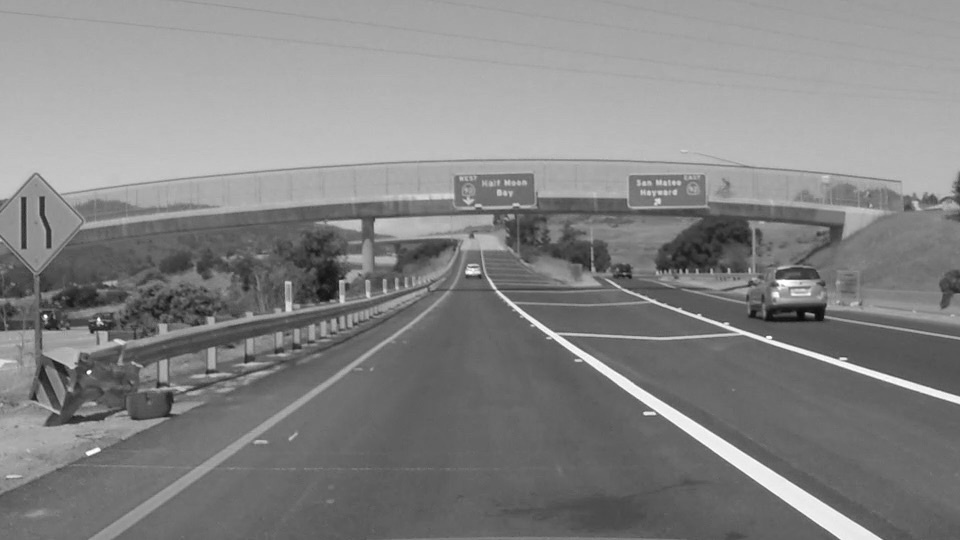
Let's go ahead and convert to grayscale.
import cv2  #bringing in OpenCV libraries
gray = cv2.cvtColor(image, cv2.COLOR_RGB2GRAY) #grayscale conversion
plt.imshow(gray, cmap='gray')
exit_gray
code and stuff
Let’s try our Canny edge detector on this image. This is where OpenCV gets useful. First, we'll have a look at the parameters for the OpenCV
Canny
function. You will call it like this:
edges = cv2.Canny(gray, low_threshold, high_threshold)
In this case, you are applying
Canny
to the image
gray
and your output will be another image called
edges
.
low_threshold
and
high_threshold
are your thresholds for edge detection.
The algorithm will first detect strong edge (strong gradient) pixels above the
high_threshold
, and reject pixels below the
low_threshold
. Next, pixels with values between the
low_threshold
and
high_threshold
will be included as long as they are connected to strong edges. The output
edges
is a binary image with white pixels tracing out the detected edges and black everywhere else. See the
OpenCV Canny Docs
for more details.
What would make sense as a reasonable range for these parameters? In our case, converting to grayscale has left us with an 8-bit image, so each pixel can take 2^8 = 256 possible values. Hence, the pixel values range from 0 to 255.
This range implies that derivatives (essentially, the value differences from pixel to pixel) will be on the scale of tens or hundreds. So, a reasonable range for your threshold parameters would also be in the tens to hundreds .
As far as a ratio of
low_threshold
to
high_threshold
,
John Canny himself recommended
a low to high ratio of 1:2 or 1:3.
We'll also include Gaussian smoothing, before running
Canny
, which is essentially a way of suppressing noise and spurious gradients by averaging (check out the
OpenCV docs for GaussianBlur
).
cv2.Canny()
actually applies Gaussian smoothing internally, but we include it here because you can get a different result by applying further smoothing (and it's not a changeable parameter within
cv2.Canny()
!).
You can choose the
kernel_size
for Gaussian smoothing to be any odd number. A larger
kernel_size
implies averaging, or smoothing, over a larger area. The example in the previous lesson was
kernel_size = 3
.
Note: If this is all sounding complicated and new to you, don't worry! We're moving pretty fast through the material here, because for now we just want you to be able to use these tools. If you would like to dive into the math underpinning these functions, please check out the free Udacity course, Intro to Computer Vision , where the third lesson covers Gaussian filters and the sixth and seventh lessons cover edge detection.
#doing all the relevant imports
import matplotlib.pyplot as plt
import matplotlib.image as mpimg
import numpy as np
import cv2
# Read in the image and convert to grayscale
image = mpimg.imread('exit-ramp.jpg')
gray = cv2.cvtColor(image, cv2.COLOR_RGB2GRAY)
# Define a kernel size for Gaussian smoothing / blurring
# Note: this step is optional as cv2.Canny() applies a 5x5 Gaussian internally
kernel_size = 3
blur_gray = cv2.GaussianBlur(gray,(kernel_size, kernel_size), 0)
# Define parameters for Canny and run it
# NOTE: if you try running this code you might want to change these!
low_threshold = 1
high_threshold = 10
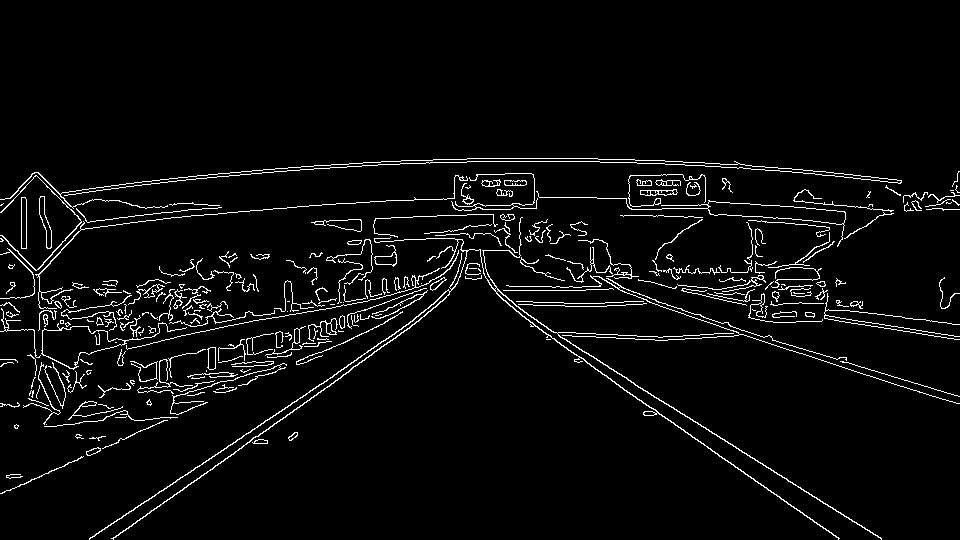
edges = cv2.Canny(blur_gray, low_threshold, high_threshold)
# Display the image
plt.imshow(edges, cmap='Greys_r')exit_edges
text
Here I've called the OpenCV function
Canny
on a Gaussian-smoothed grayscaled image called
blur_gray
and detected edges with thresholds on the gradient of
high_threshold
, and
low_threshold
.
In the next quiz you'll get to try this on your own and mess around with the parameters for the Gaussian smoothing and Canny Edge Detection to optimize for detecting the lane lines and not a lot of other stuff.